Market Basics · Chart Academy · Levels, trendlines and channels · Updated 2026-08-30
Support, resistance, trendlines and channels
Levels are zones, not one-pixel lines. Role reversal, honest trendlines, and reading channel rhythm without predicting from it.
지지·저항 구간, 추세선과 채널 — 레벨은 선이 아니라 구간입니다. 역할 전환, 정직한 추세선, 그리고 예측 없이 채널의 리듬을 읽는 법.
What it is
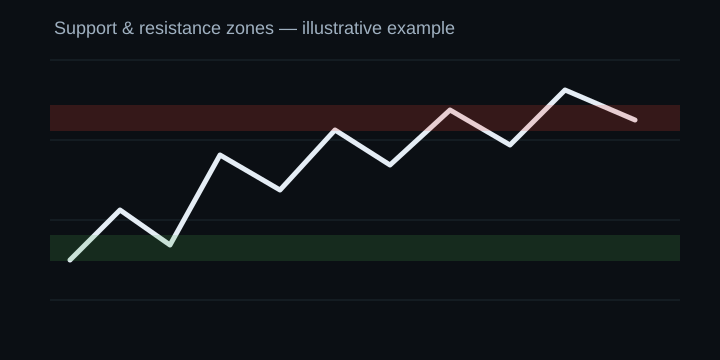
Support and resistance are areas where price has repeatedly reacted. They come from prior swing highs and lows, from gaps, and from obvious places where acceptance or rejection happened before.
They are almost always zones rather than exact prices. A level drawn as a single pixel will be 'broken' constantly by noise; the same level drawn as a band describes what actually happens. Zones widen when volatility is high — the same level on a calm chart and a violent one deserves a different thickness.
How to spot it
Look for areas price has visited more than once and left from decisively. Then ask what happened at each visit: did price close through and stay, or touch and retreat?
For trendlines, connect meaningful swing points. Two anchors make a line; further clean reactions make it credible. Do not cut a line through the middle of price just to make it touch more points — a line that needs to be forced is telling you the trend is not linear.
The step-by-step drawing procedure — which timeframe and scale first, wick or body, how to judge a break, and a checklist — is its own practical lesson: How to draw levels, trendlines and channels.
- Ascending channel — parallel rising boundaries.
- Descending channel — parallel falling boundaries.
- Horizontal channel — a range with parallel edges.
- The channel midline is a reference for rhythm, not a prediction.
Why people watch it
Levels are where decisions cluster. Role reversal — broken resistance later acting as support, broken support later acting as resistance — is the single most useful behaviour on a chart, because it gives a broken level a second, testable life.
Treat role reversal as a behaviour to observe, not a law. It often happens; it is not owed to you.
Confirmation
A zone is confirmed as meaningful by repeated, visible reaction — not by how neatly you drew it. A role reversal is confirmed when price returns to the broken level and reacts from the new side.
Invalidation
A zone stops being useful when price moves through it without reacting. A trendline is invalidated when price closes decisively through it and the following reaction ignores it entirely — a trendline break is information, not an automatic reversal.
Common mistakes
- Drawing levels as exact prices and then being surprised by wicks.
- Redrawing a trendline every time it breaks until it fits again.
- Assuming a steeper trendline is a stronger trend — steep lines break more often and usually describe acceleration, not durability.
- Treating the channel midline as a target.
Illustrative example
Quick check
1. Why does GMR draw support and resistance as zones?
- To look more sophisticated
- Because a one-pixel line is broken constantly by noise and misdescribes what happens
- Because zones are always more accurate
- To make backtesting easier
Show answer
B. Because a one-pixel line is broken constantly by noise and misdescribes what happens
Price reacts to areas, not to exact numbers. A zone describes the behaviour; a line describes a wish.
2. Broken resistance later holds as support. What is this called, and how should it be treated?
- Role reversal — a guaranteed rule
- Role reversal — a behaviour to observe, not a law
- A false break
- A double bottom
Show answer
B. Role reversal — a behaviour to observe, not a law
It happens frequently enough to be worth watching for and rarely enough that treating it as guaranteed will eventually be expensive.
3. Your trendline only works if you draw it through several candle bodies. What does that tell you?
- The trendline is fine, bodies do not matter
- The trend is exceptionally strong
- You are forcing the line — the trend may not be linear
- You should switch to a log scale
Show answer
C. You are forcing the line — the trend may not be linear
A line that has to be forced is describing your preference rather than the market's behaviour.