Market Basics · Chart Academy · Market structure · Updated 2026-08-30
Market structure: HH, HL, LH, LL
Mark the swings before you open a single indicator. Uptrend, downtrend, range and transition — and the difference between a local break and a character change.
시장 구조: 고점·저점의 흐름 — 지표를 켜기 전에 스윙 고점과 저점부터 표시하세요. 상승·하락·박스권·전환, 그리고 국지적 이탈과 성격 변화의 차이.
What it is
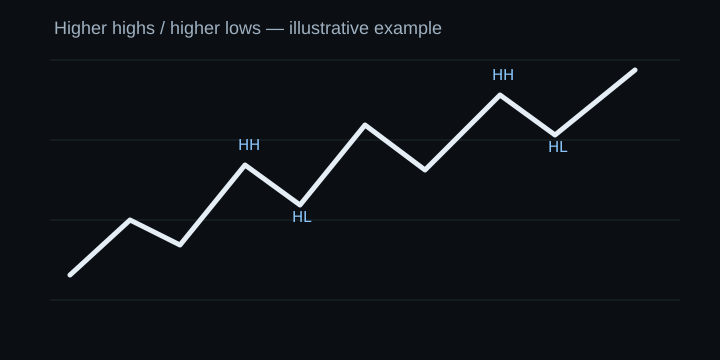
Market structure is the sequence of swing highs and swing lows. It is the most durable thing on a chart and the first thing to establish, before any indicator is opened.
- Uptrend — higher highs and higher lows.
- Downtrend — lower highs and lower lows.
- Range — repeated boundaries without directional progression in the swings.
- Transition — mixed structure after a break or a failed trend, where neither description fits yet.
How to spot it
Mark the obvious turning points first — the ones you would point at without hesitation. Then read the sequence. If each turning point is higher than the last on both the highs and the lows, that is an uptrend, and it stays one until the sequence breaks.
'Transition' is a real and useful label. Most of the disagreement in chart reading comes from people forcing a trend label onto a chart that has not decided yet.
How many swing points to mark is a judgement call, and the useful discipline is consistency: pick a level of detail that matches the timeframe you are describing, then apply it across the whole chart rather than zooming into the parts that support your view.
Why people watch it
Structure is what gives everything else meaning. The same candle, the same indicator reading and the same pattern mean different things inside an uptrend, a downtrend and a range. Establishing structure first is what stops an analysis from being a collection of unrelated observations.
Confirmation
A structure break is confirmed by a close beyond the relevant swing point, not by a wick through it. Which swing point matters depends on the timeframe you are describing.
Invalidation
If price reclaims the broken swing point and closes back inside the prior structure, the break failed. A failed break often carries more information than a clean one, because it shows an attempt that could not find acceptance.
Common mistakes
- Treating a minor low breaking inside a larger uptrend as a full trend reversal. Separate local structure breaks from higher-timeframe ones.
- Marking so many swing points that every wiggle becomes structure.
- Refusing to use the word 'range' because it feels like not having an opinion.
- Presenting break-of-structure terminology as proprietary truth rather than one common way to describe price.
Illustrative example
Quick check
1. Price makes a lower low on the 15-minute chart while the daily is still making higher highs and higher lows. What is the correct description?
- The uptrend has reversed
- A local structure break inside a higher-timeframe uptrend
- A range
- The daily chart is wrong
Show answer
B. A local structure break inside a higher-timeframe uptrend
Both statements are true at their own timeframe. Collapsing them into one verdict is where most bad chart reads begin.
2. What confirms a structure break?
- A wick through the swing point
- A close beyond the swing point
- RSI leaving its range
- Three candles in the same direction
Show answer
B. A close beyond the swing point
Wick versus close is the distinction that runs through the whole curriculum: touching a level is not the same as accepting beyond it.
3. Why is 'transition' a useful label?
- It sounds more professional
- It avoids forcing a trend label onto a chart that has not decided
- It predicts a reversal
- It is only used on weekly charts
Show answer
B. It avoids forcing a trend label onto a chart that has not decided
Naming uncertainty honestly is more useful than a confident label the price action does not support.